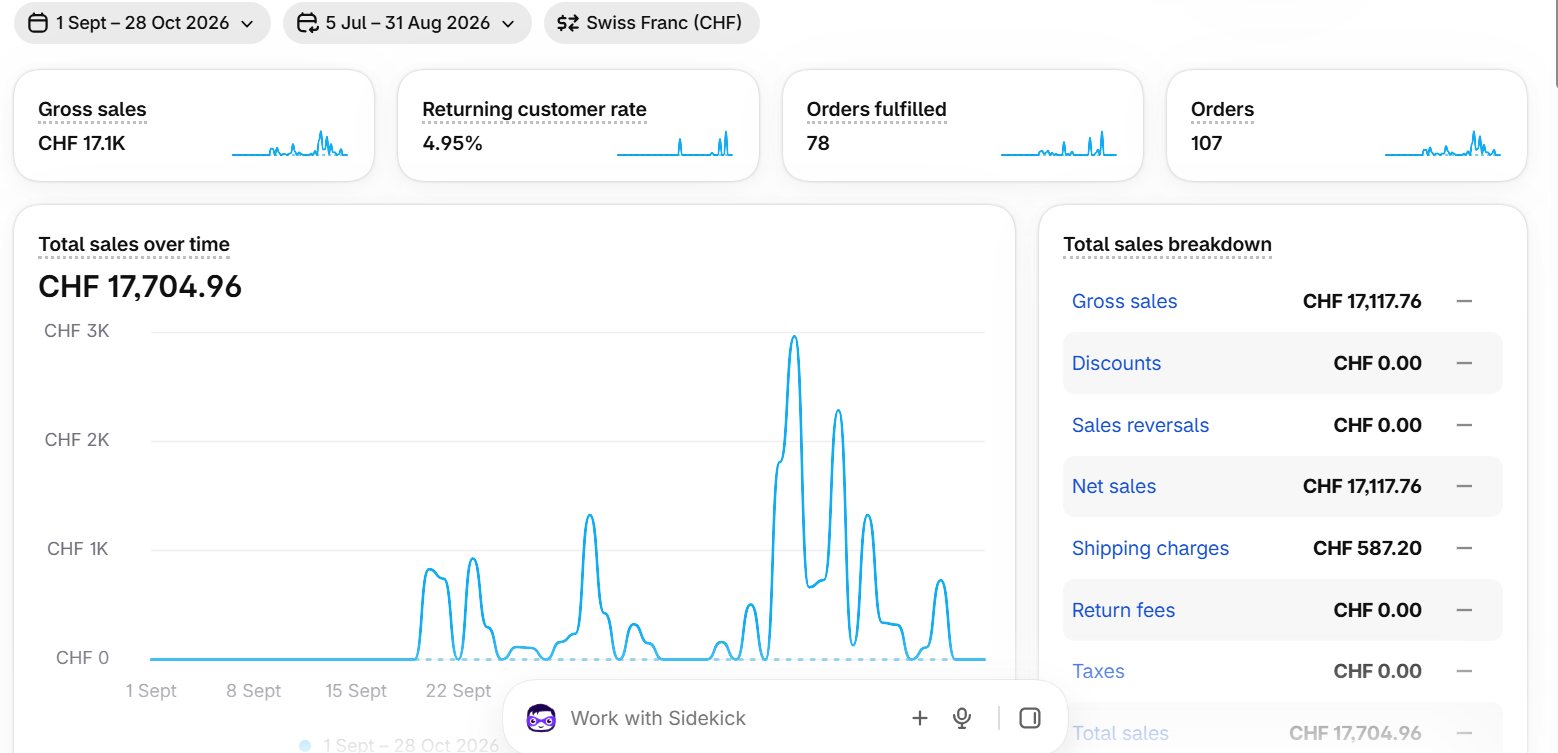
Total sales
CHF 17,704.96
1 Sept – 28 Oct 2026
- 107 orders received
- 78 orders fulfilled
- Gross sales CHF 17,117.76

Selected work
Every project below shipped with tracked outcomes. Open a case study to see the challenge, the approach and the results.
How we measure success
A beautiful redesign that doesn't convert isn't a win, and a campaign that drives traffic without profit isn't either. Before we touch a project we agree with the client on the two or three numbers that actually matter — conversion rate, revenue, ROAS, organic sessions — and we report against those, not against whichever metric happened to move.
That discipline is why the results below are specific: percentages, dollar figures and time saved, tied to a documented before-and-after rather than a general sense that things got better.
150+
Happy Clients
300+
Projects Completed
$2M+
Revenue Generated
98%
Client Satisfaction
Proof
Our work is evaluated using real performance indicators — total sales, order volume and attributed marketing revenue. Explore selected dashboard results and see the numbers behind our approach to e-commerce growth.
CHF 17,704.96
1 Sept – 28 Oct 2026
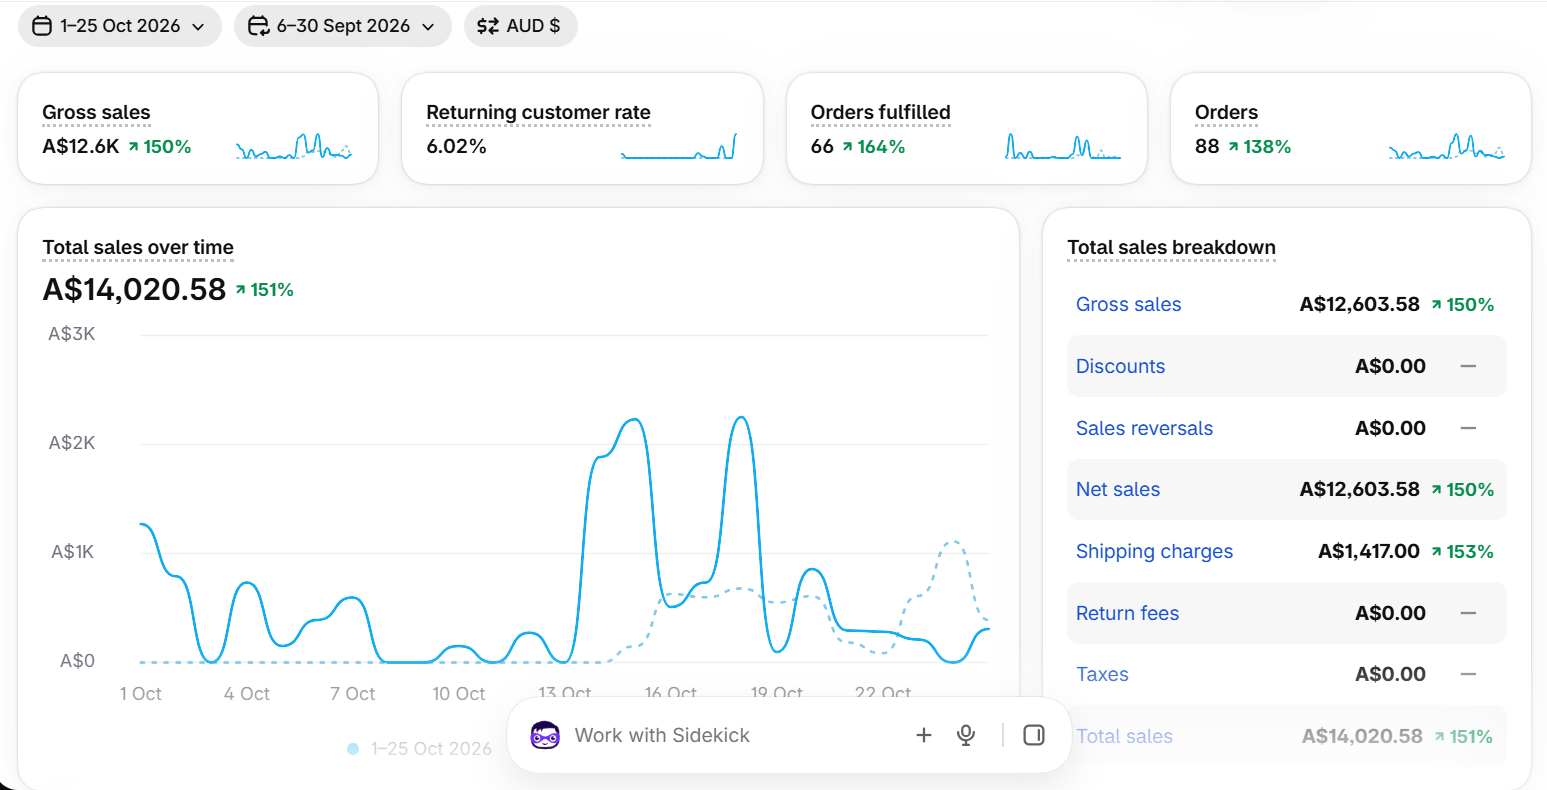
A$14,020.58
1 – 25 Oct 2026
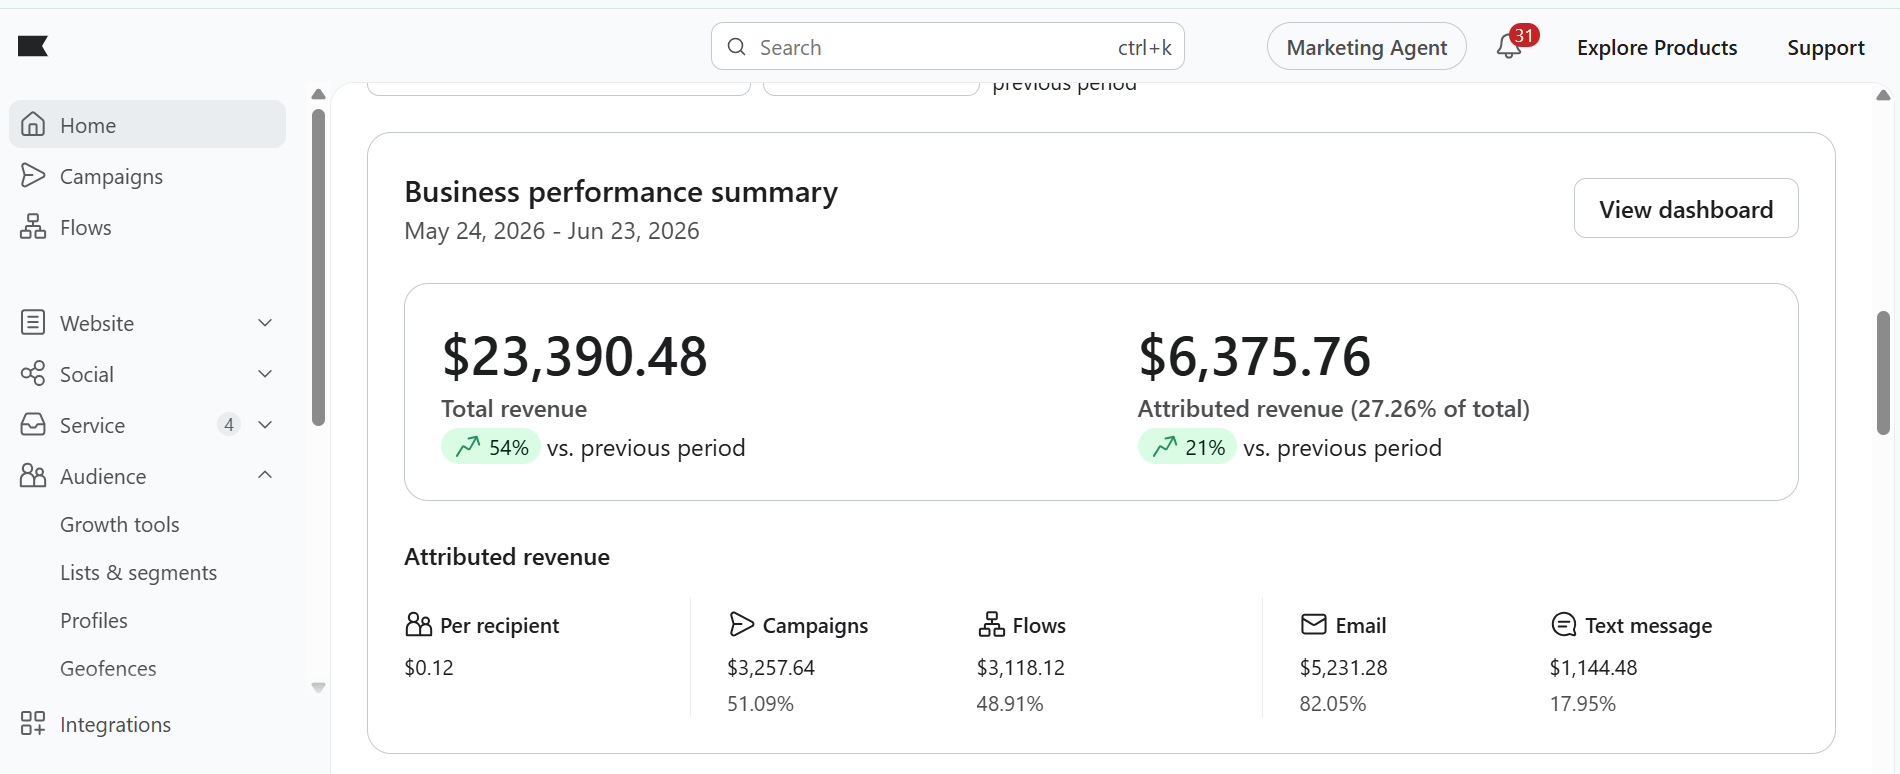
$6,375.76
24 May – 23 Jun 2026
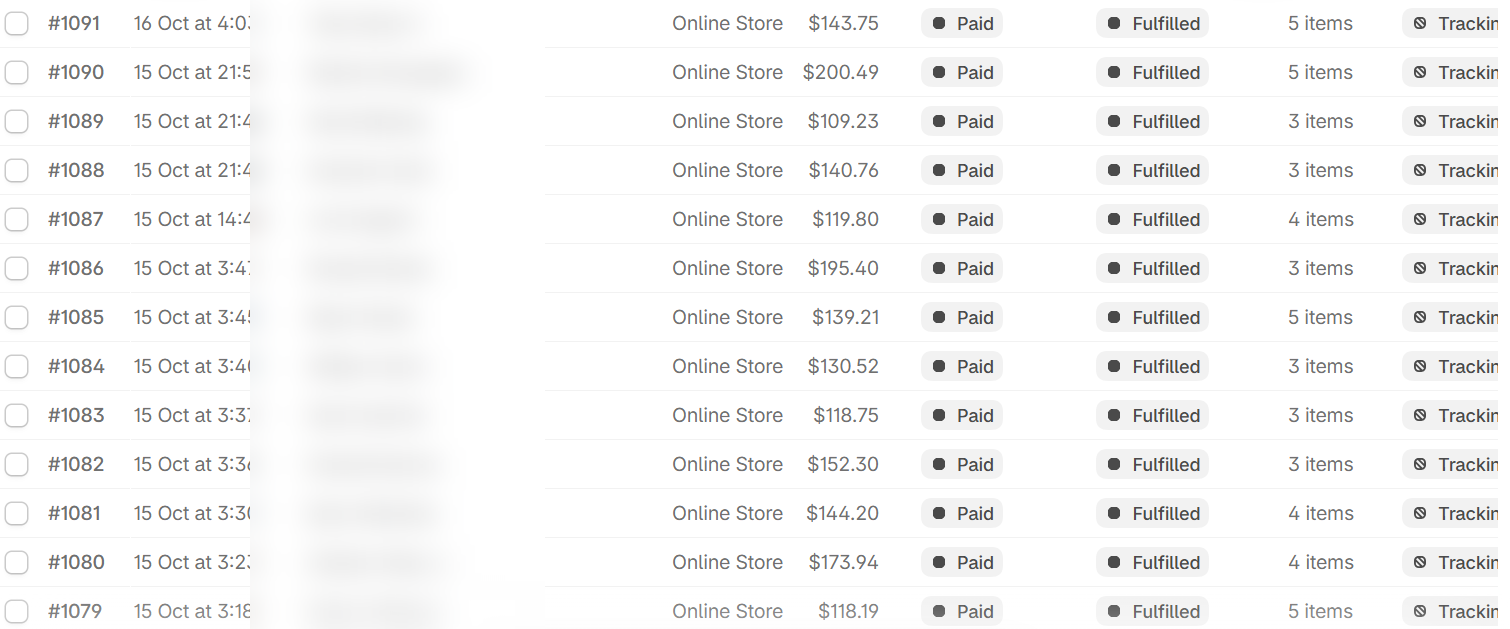
Behind every dashboard figure is a real order record: paid, fulfilled and tracked through to the customer. This is the level of follow-through we hold every store we work on to.
Figures shown come from separate store reporting dashboards across different periods and currencies. Sales figures represent revenue, not net profit.
Discuss your project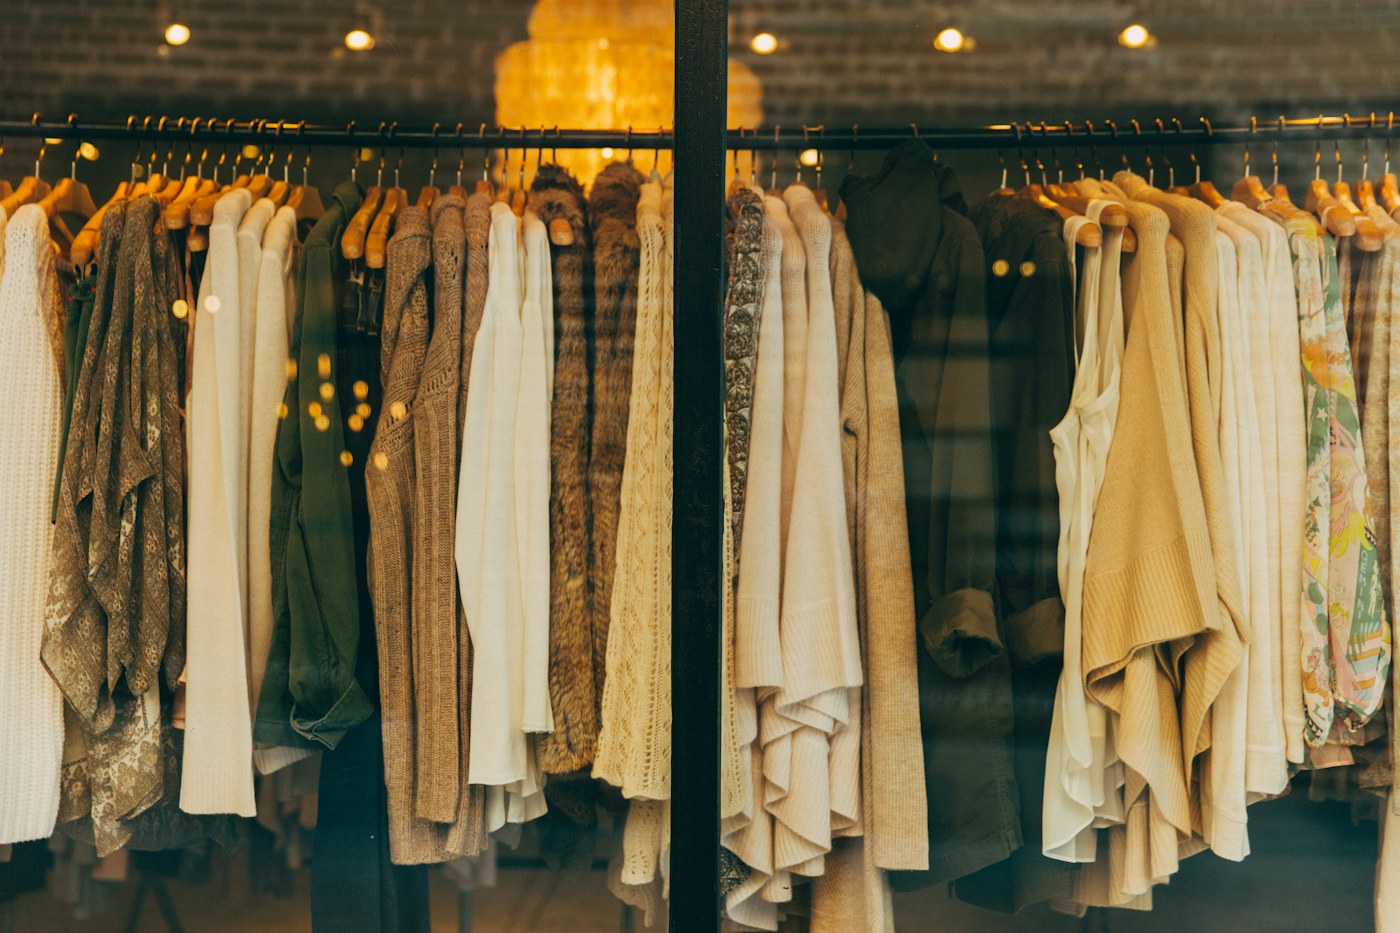
A fashion boutique rebuilt around editorial imagery and a frictionless mobile checkout.
+64%
Conversion rate
+118%
Mobile revenue
-2.1s
Load time
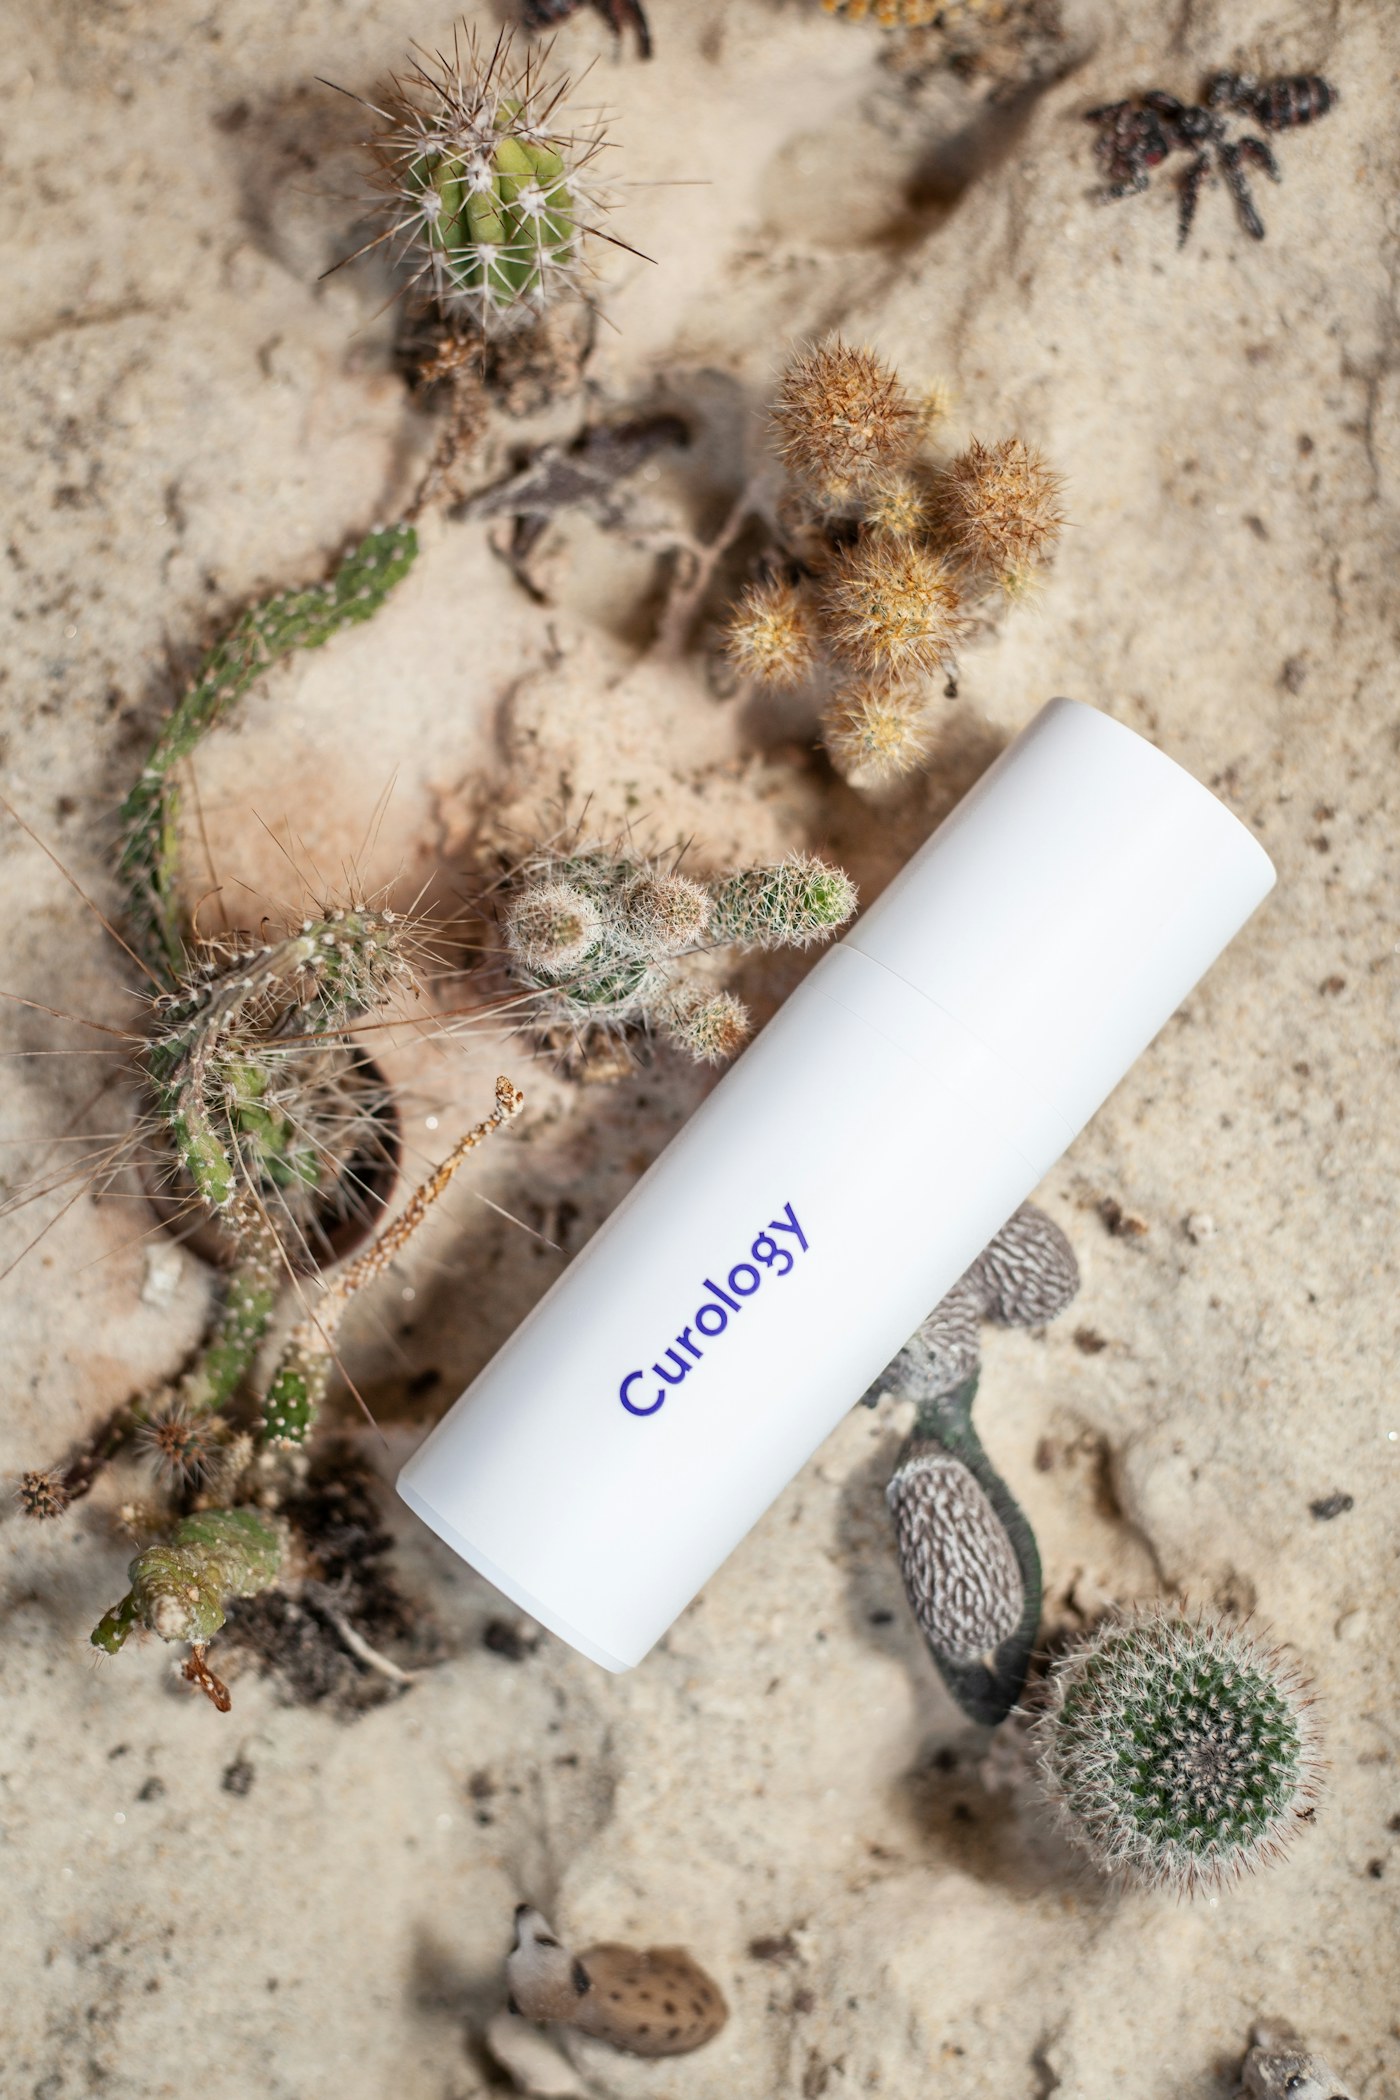
Skincare brand scaled from launch to consistent six-figure months with paid + lifecycle.
3.8x
ROAS
31%
Email revenue share
+47%
Repeat purchase
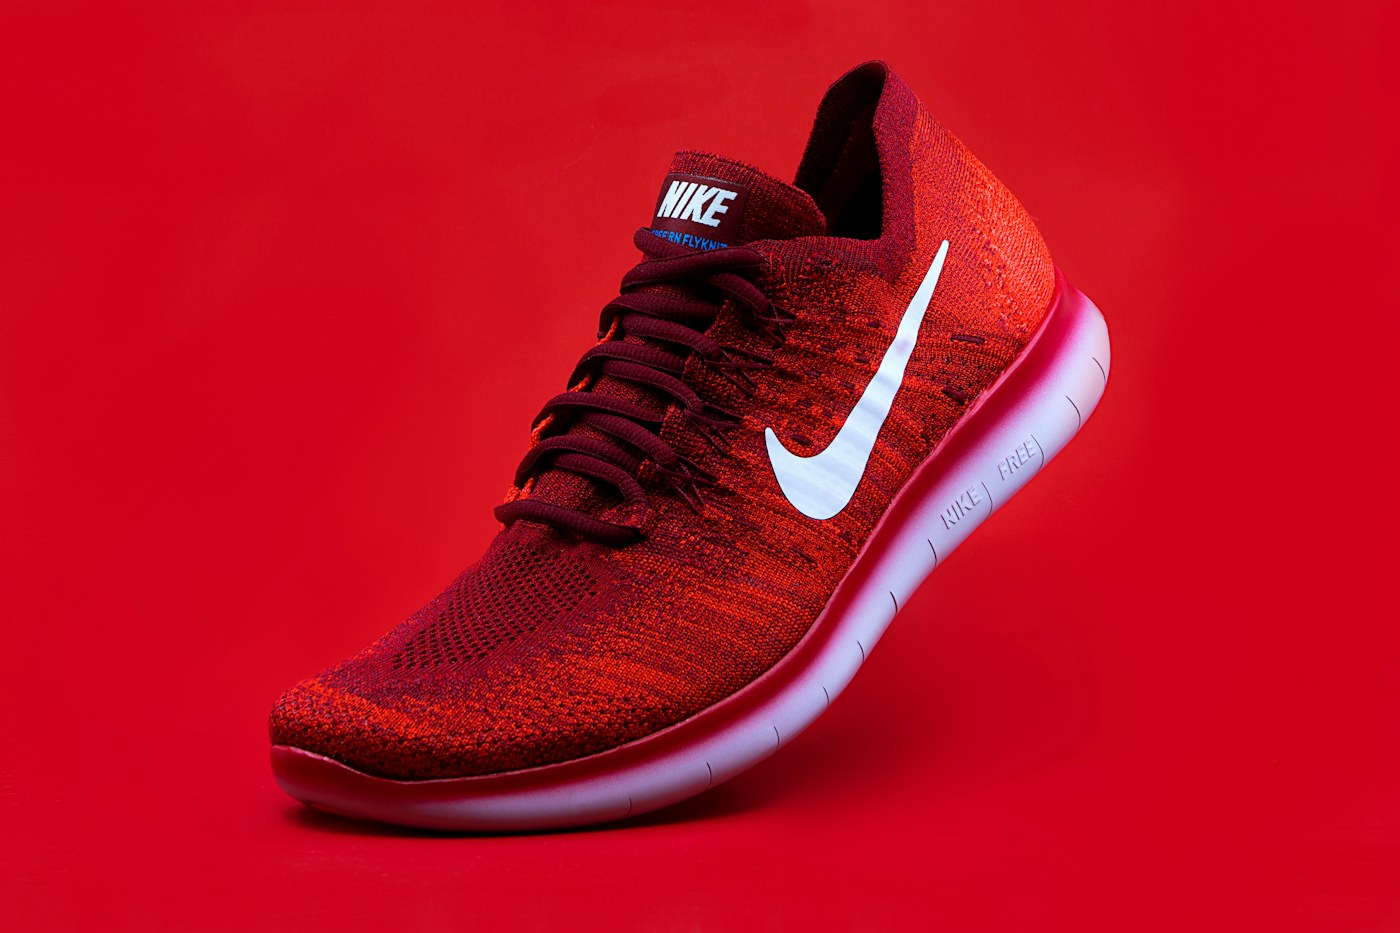
Sneaker retailer migrated from WooCommerce to Shopify with zero ranking loss.
+38%
Organic traffic
100%
Drop-day uptime
+22%
AOV
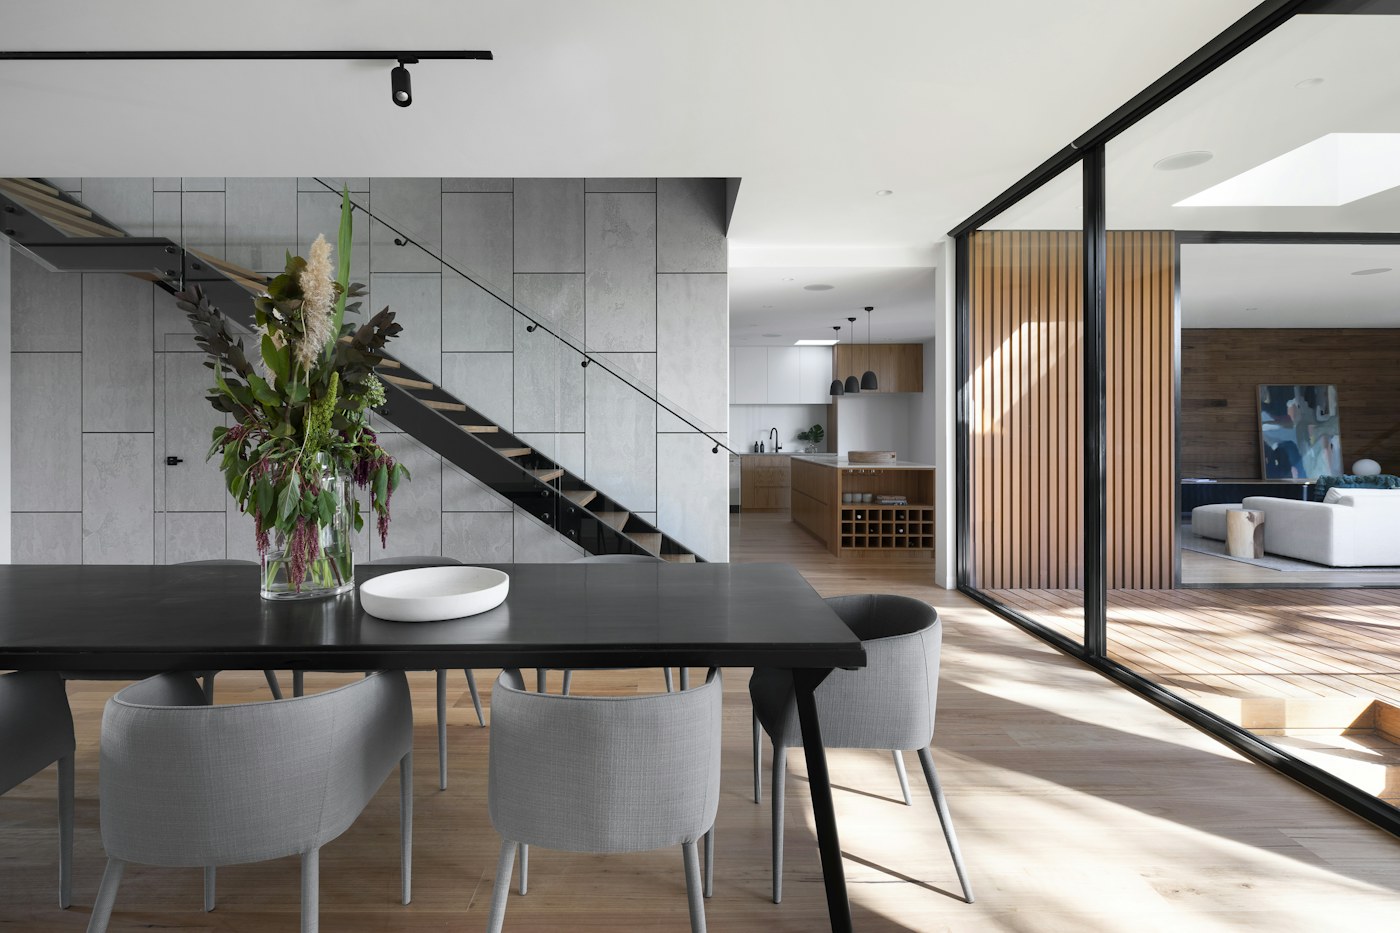
Home decor brand given a premium storefront with room-based shopping journeys.
+81%
Pages / session
+43%
Add to cart
$96k
Bundle revenue
Supplement brand grew to page-one rankings for its highest-intent category terms.
+212%
Organic sessions
34
Top-3 keywords
+167%
Organic revenue

Fine jewellery label positioned for luxury with a slow, tactile browsing experience.
+58%
AOV
+39%
Conversion rate
-11%
Return rate

Who we serve
Methodology
The same four-step method behind every project on this page.
01
Before any design or campaign work starts, we pull conversion rate, traffic sources, AOV and site speed so every result can be measured against a real starting point.
02
We prioritise fixes by revenue impact, not by what's easiest to build — the audit ranks issues so effort goes where it moves the needle first.
03
Every change ships with tracking already wired in, so we can attribute lift to the specific change rather than guessing after the fact.
04
Case studies use the same metrics clients see in their own dashboard — no vanity numbers, no cherry-picked date ranges.
Typical outcomes
Patterns we see across most projects — actual results vary by store and are reported per case study above.
4–6 click path to purchase
2–3 click path to purchase
3–5s page load on mobile
Under 2s page load on mobile
No lifecycle email flows
6–9 automated flows live
Generic collection pages
Schema-rich, keyword-mapped pages
Working together
A working session to align on goals, timeline and how we'll measure success together.
A short async or live update with a staging link so you can see progress as it happens.
Structured review rounds before anything goes live, so there are no launch-day surprises.
Results are tracked against the original baseline and shared in a plain-language report.
Tell us about your store and we'll come back with a plan, a timeline and a fixed price.
Start a project